
See the move options are pricing.
Every option price carries the market's estimate of how far a stock will move. Tempest reads it for every stock and measures it against that stock's own history, so you know whether options are priced rich or cheap before you choose a strike, a stop or a target.
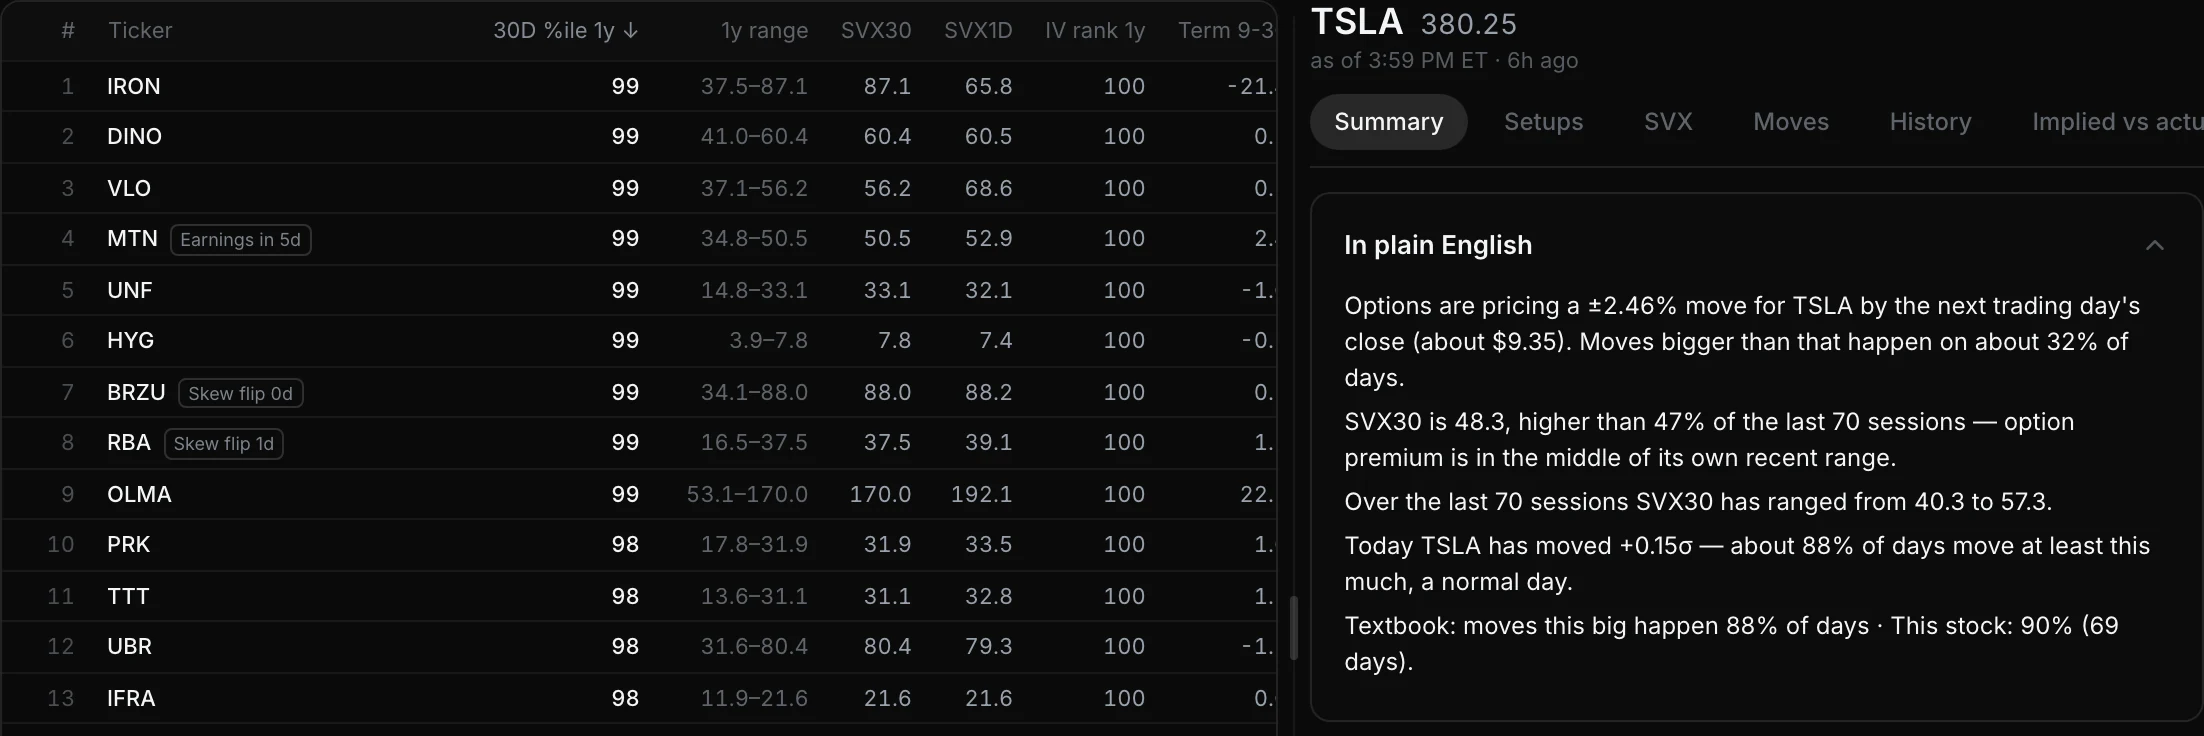
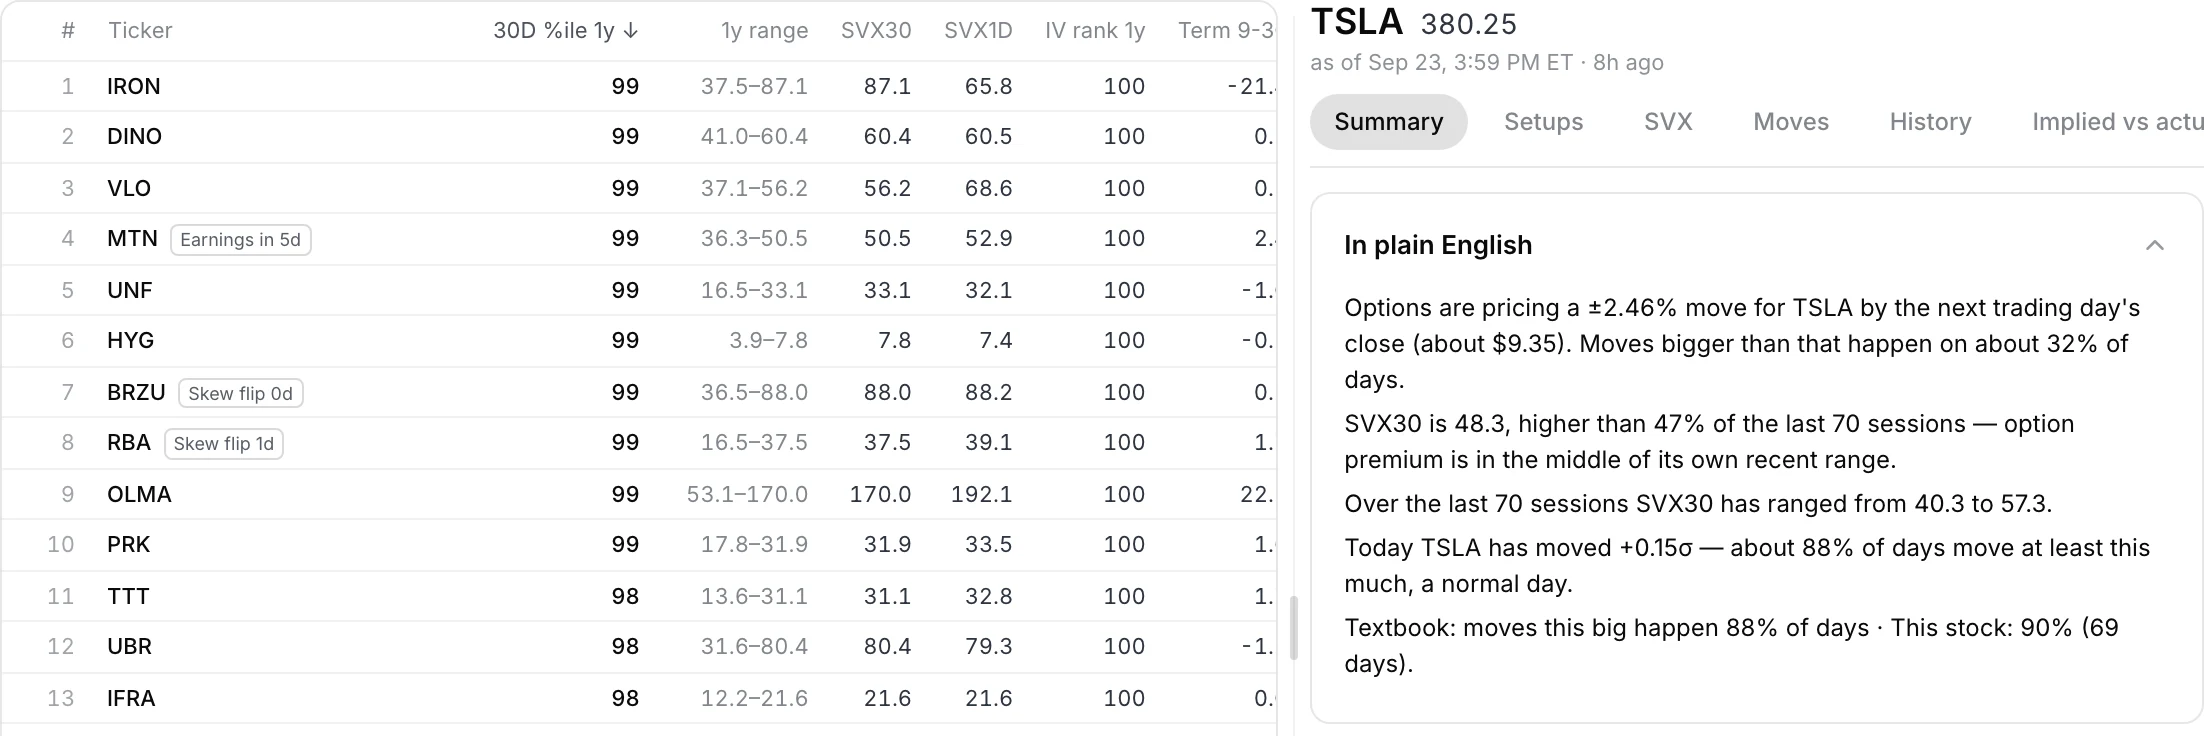
Before every trade
Three questions options already answer. Tempest reads them for you.
How big a move is priced?
By today's close, this week or this month, in dollars. A yardstick for targets, stops and strikes.
Are options cheap or expensive?
Against the stock's own past, not a one-size-fits-all number.
Is today ordinary or unusual?
Today's move measured in expected moves, on the stock's own ruler.
SVX · Skylit Volatility Index
A VIX for every stock.
SVX turns option prices into one number per stock, the way the VIX does for the S&P 500. It sizes the swing, not its direction. Slide it to see what a reading means in plain moves.
Is SVX 100 a lot? For SPY it would be a crisis. For GME it can be an ordinary week. So Tempest ranks every stock against its own history, not by the raw number.
Typical of: Mega-cap tech on an ordinary day
One-standard-deviation moves: price finishes inside them on about 68% of days.
The radar
The whole market, ranked in one table.
Which stocks have unusually cheap or expensive options today, each measured against its own history, so you stop checking names one by one.
Group by sector, theme or the Mag 7. Match the horizon to your hold: 1D, 9D, 30D or 3M.
- Rich vol
- Cheap vol
- Backwardation
- Sigma event
- Big mover today
- Earnings soon
- Skew flip
- Coiled
One stock, every reading
Everything options are saying, panel by panel.
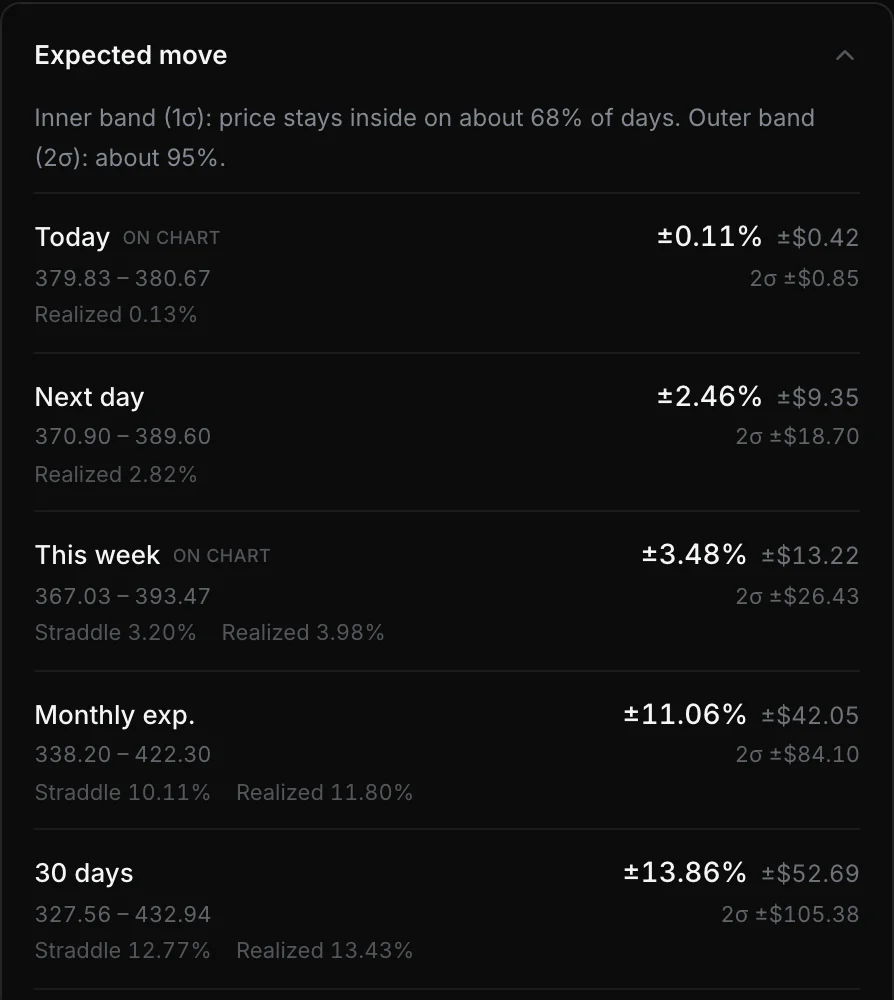
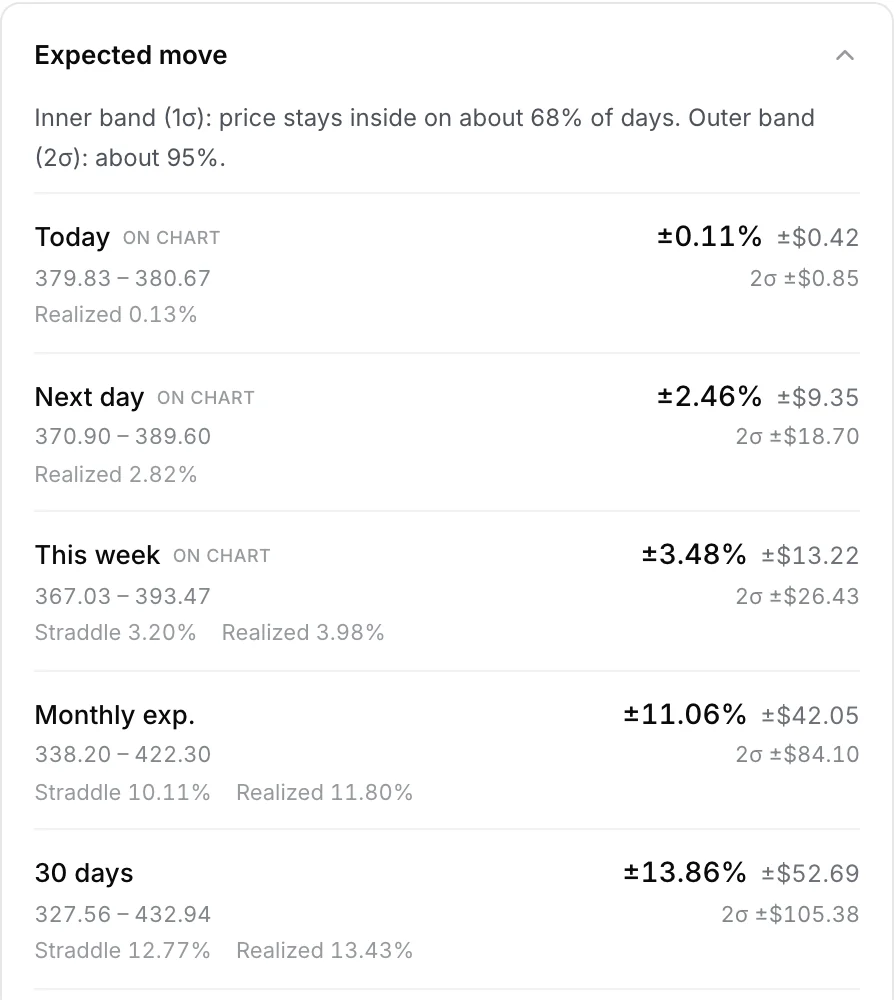
Expected move
The priced range, in dollars.
Today, next day, this week, monthly expiry and 30 days, each as a ± move and a price range. Next to it: what the straddle charges and what the stock has actually been moving.
- Inner band: price stays inside on about 68% of days
- Drawn on your Atlas chart as cones and fixed range levels
On your Atlas chart · Beta
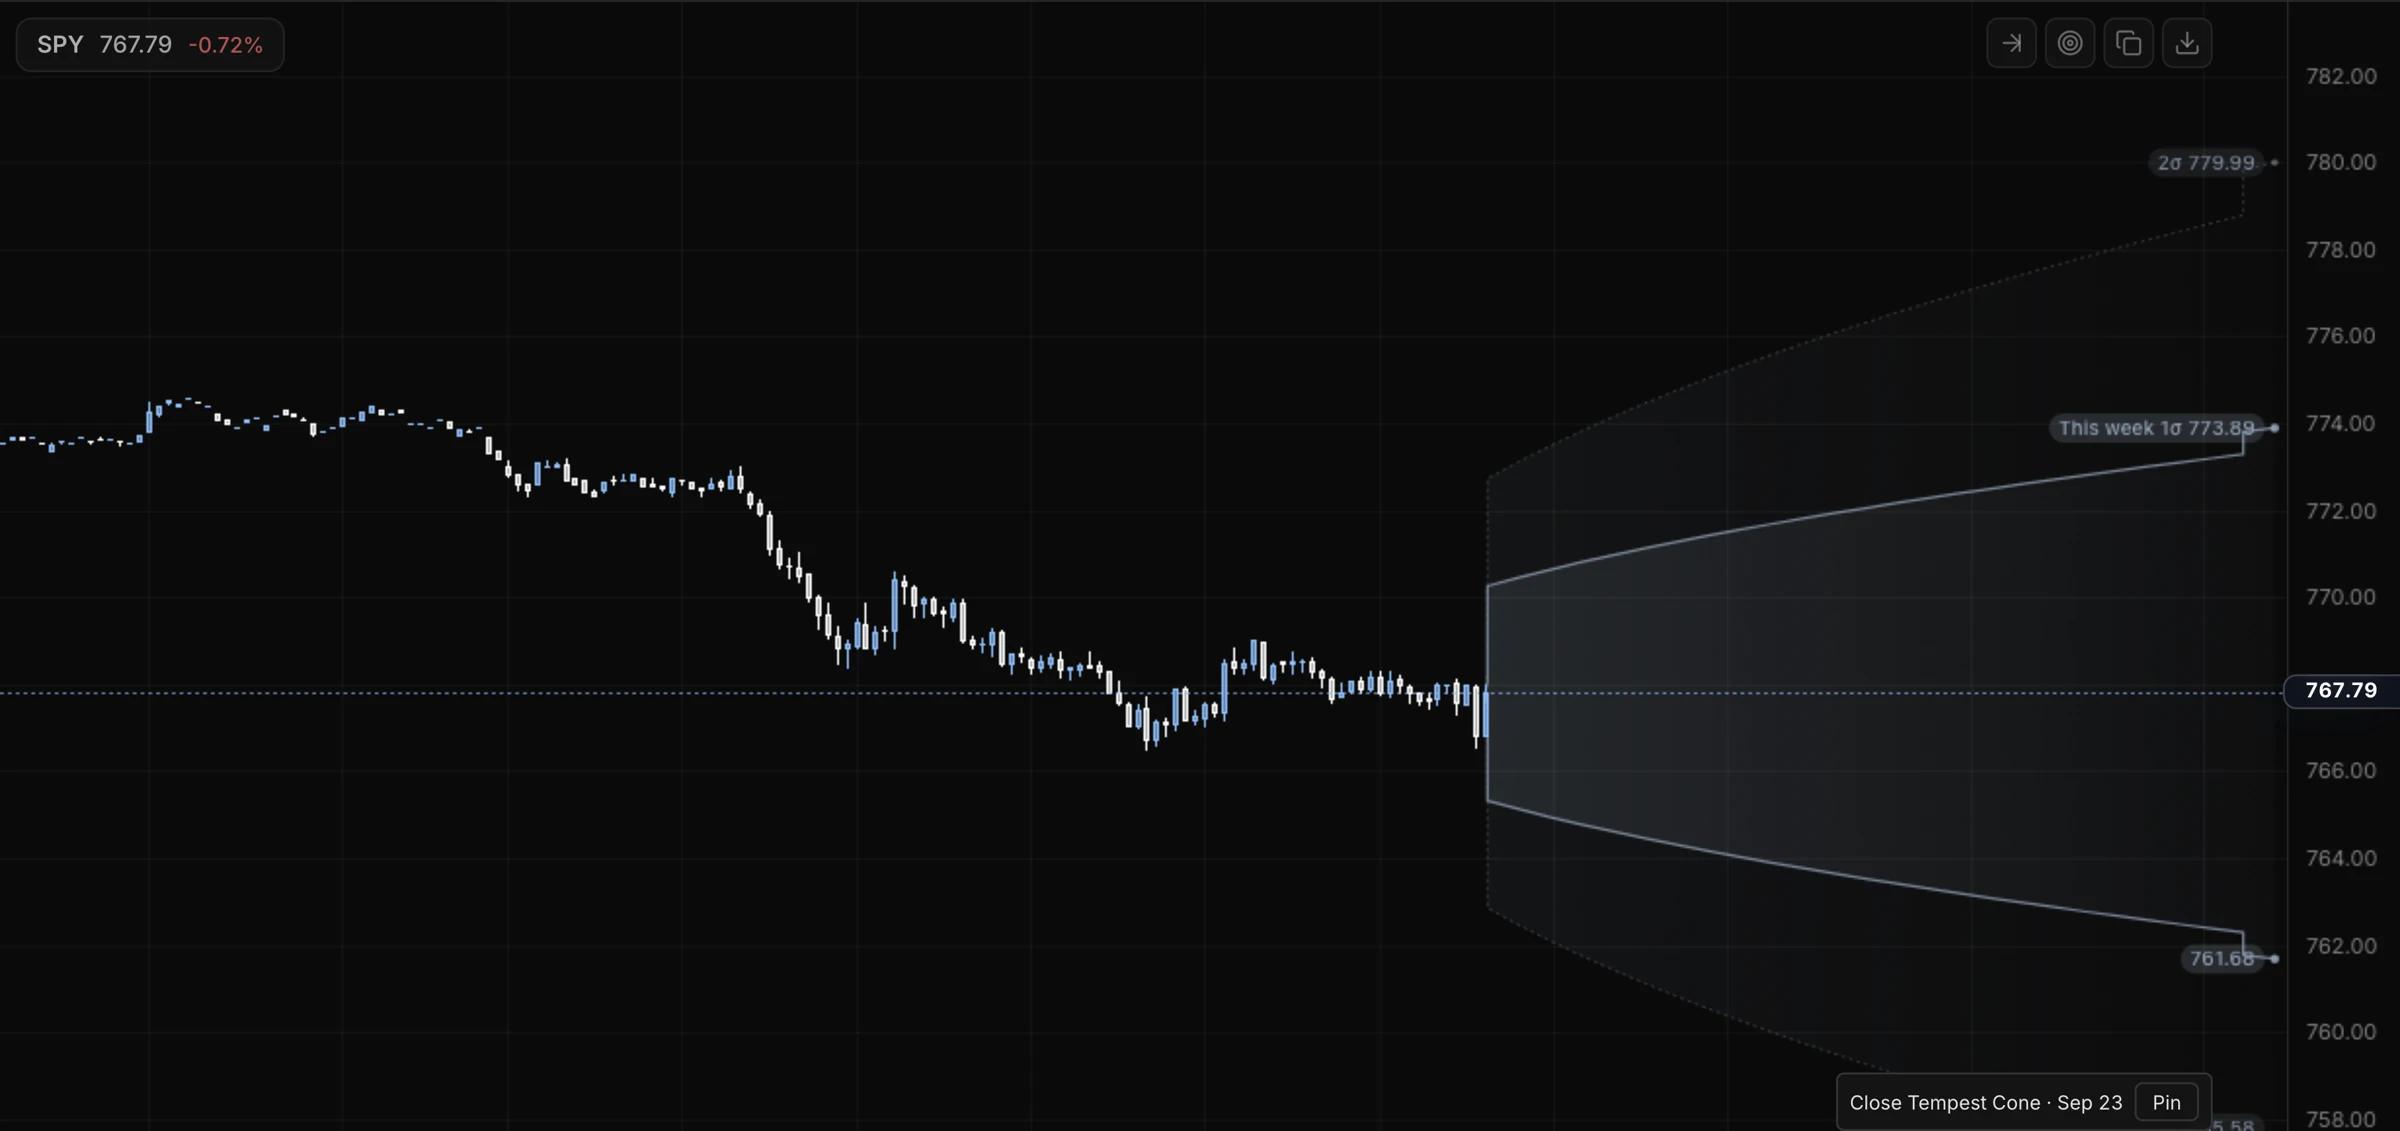
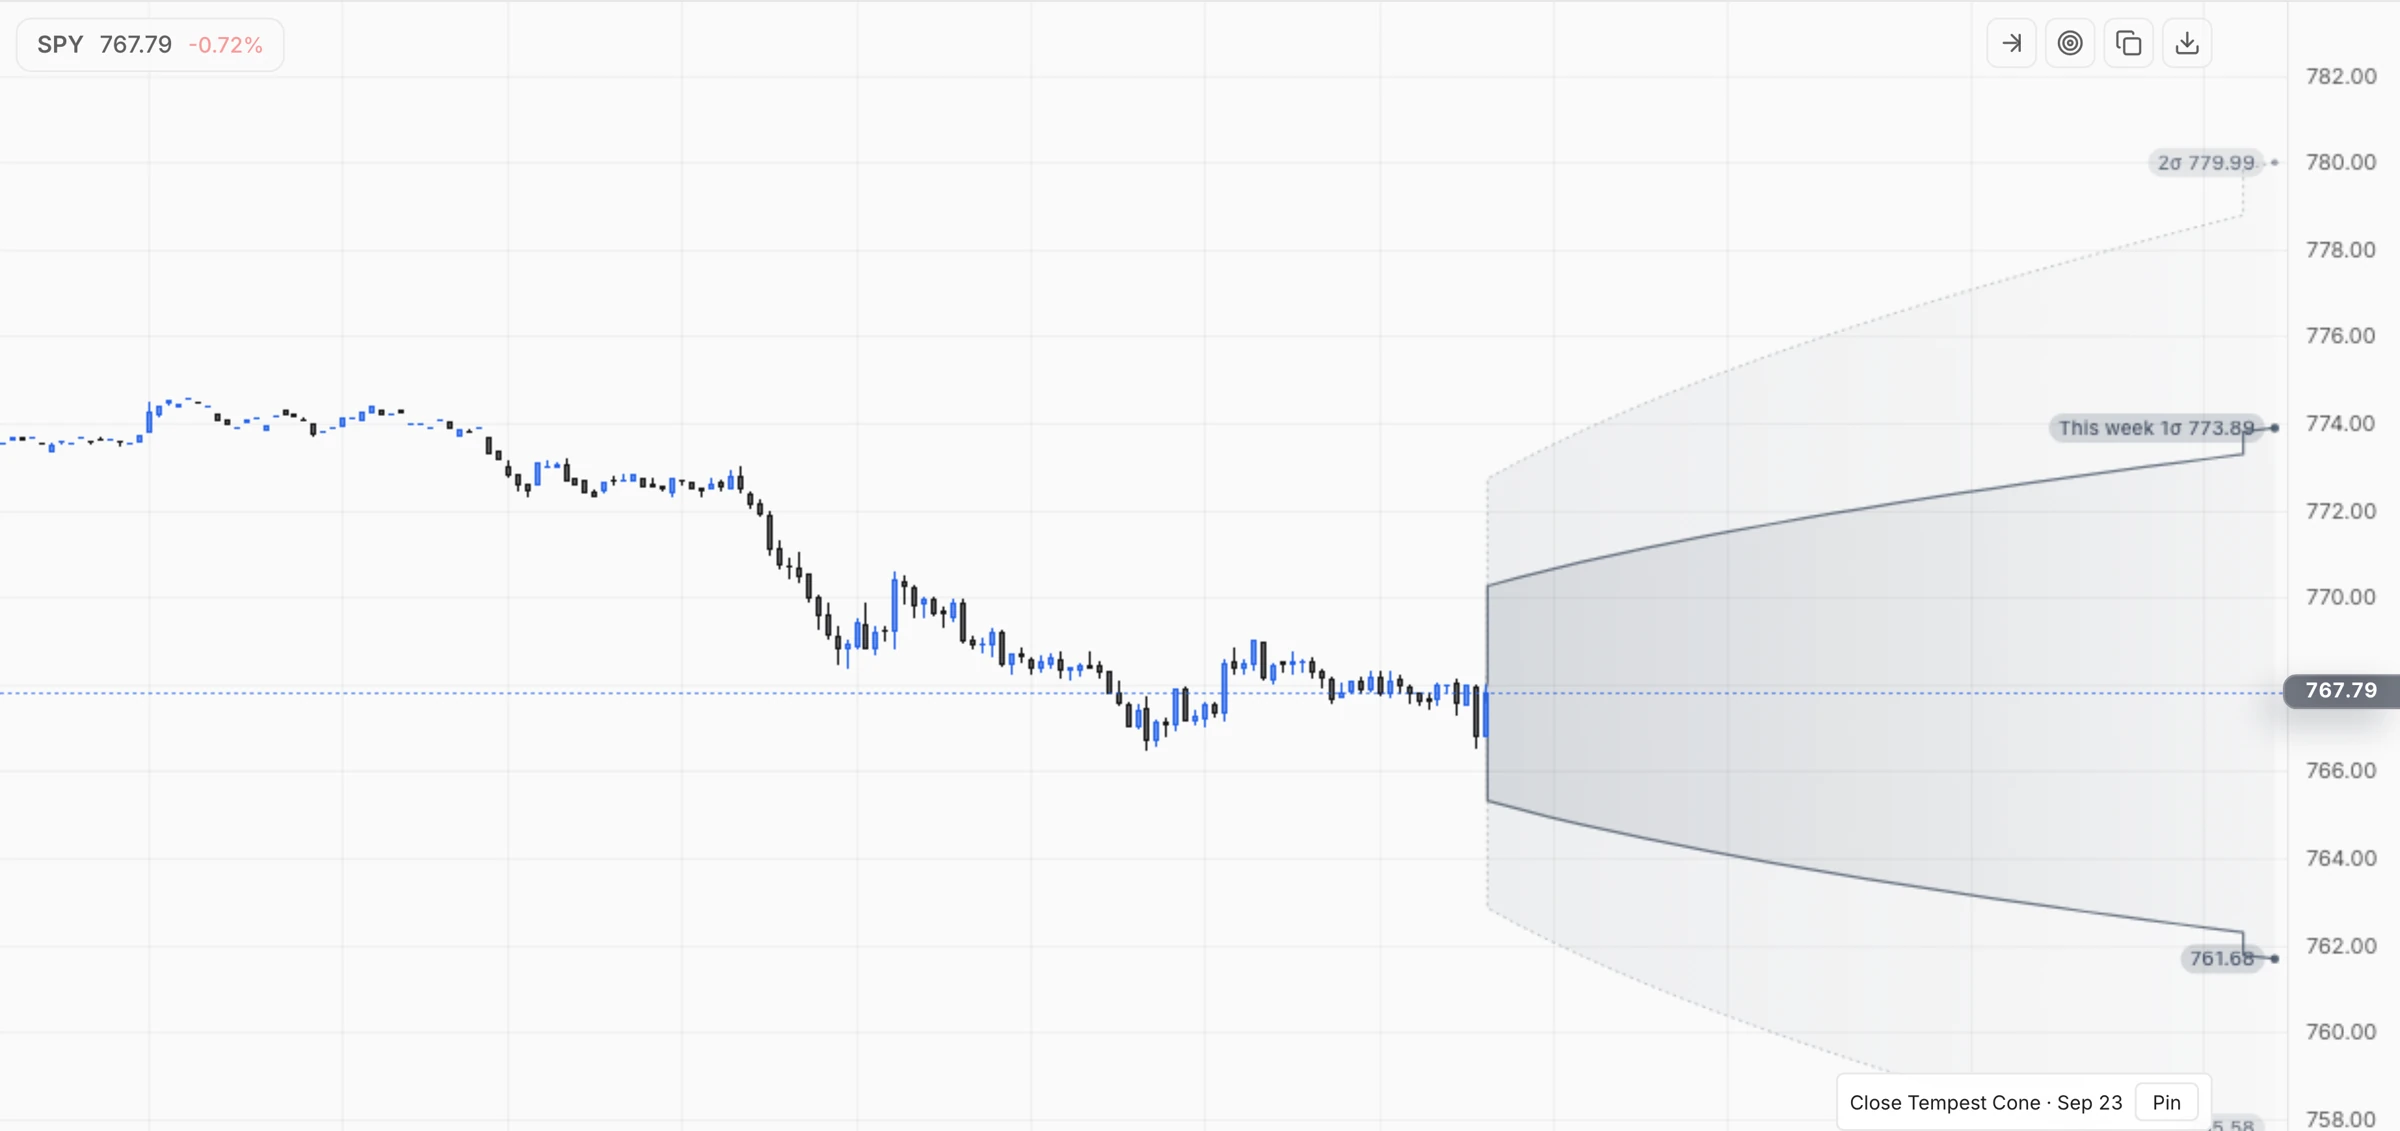
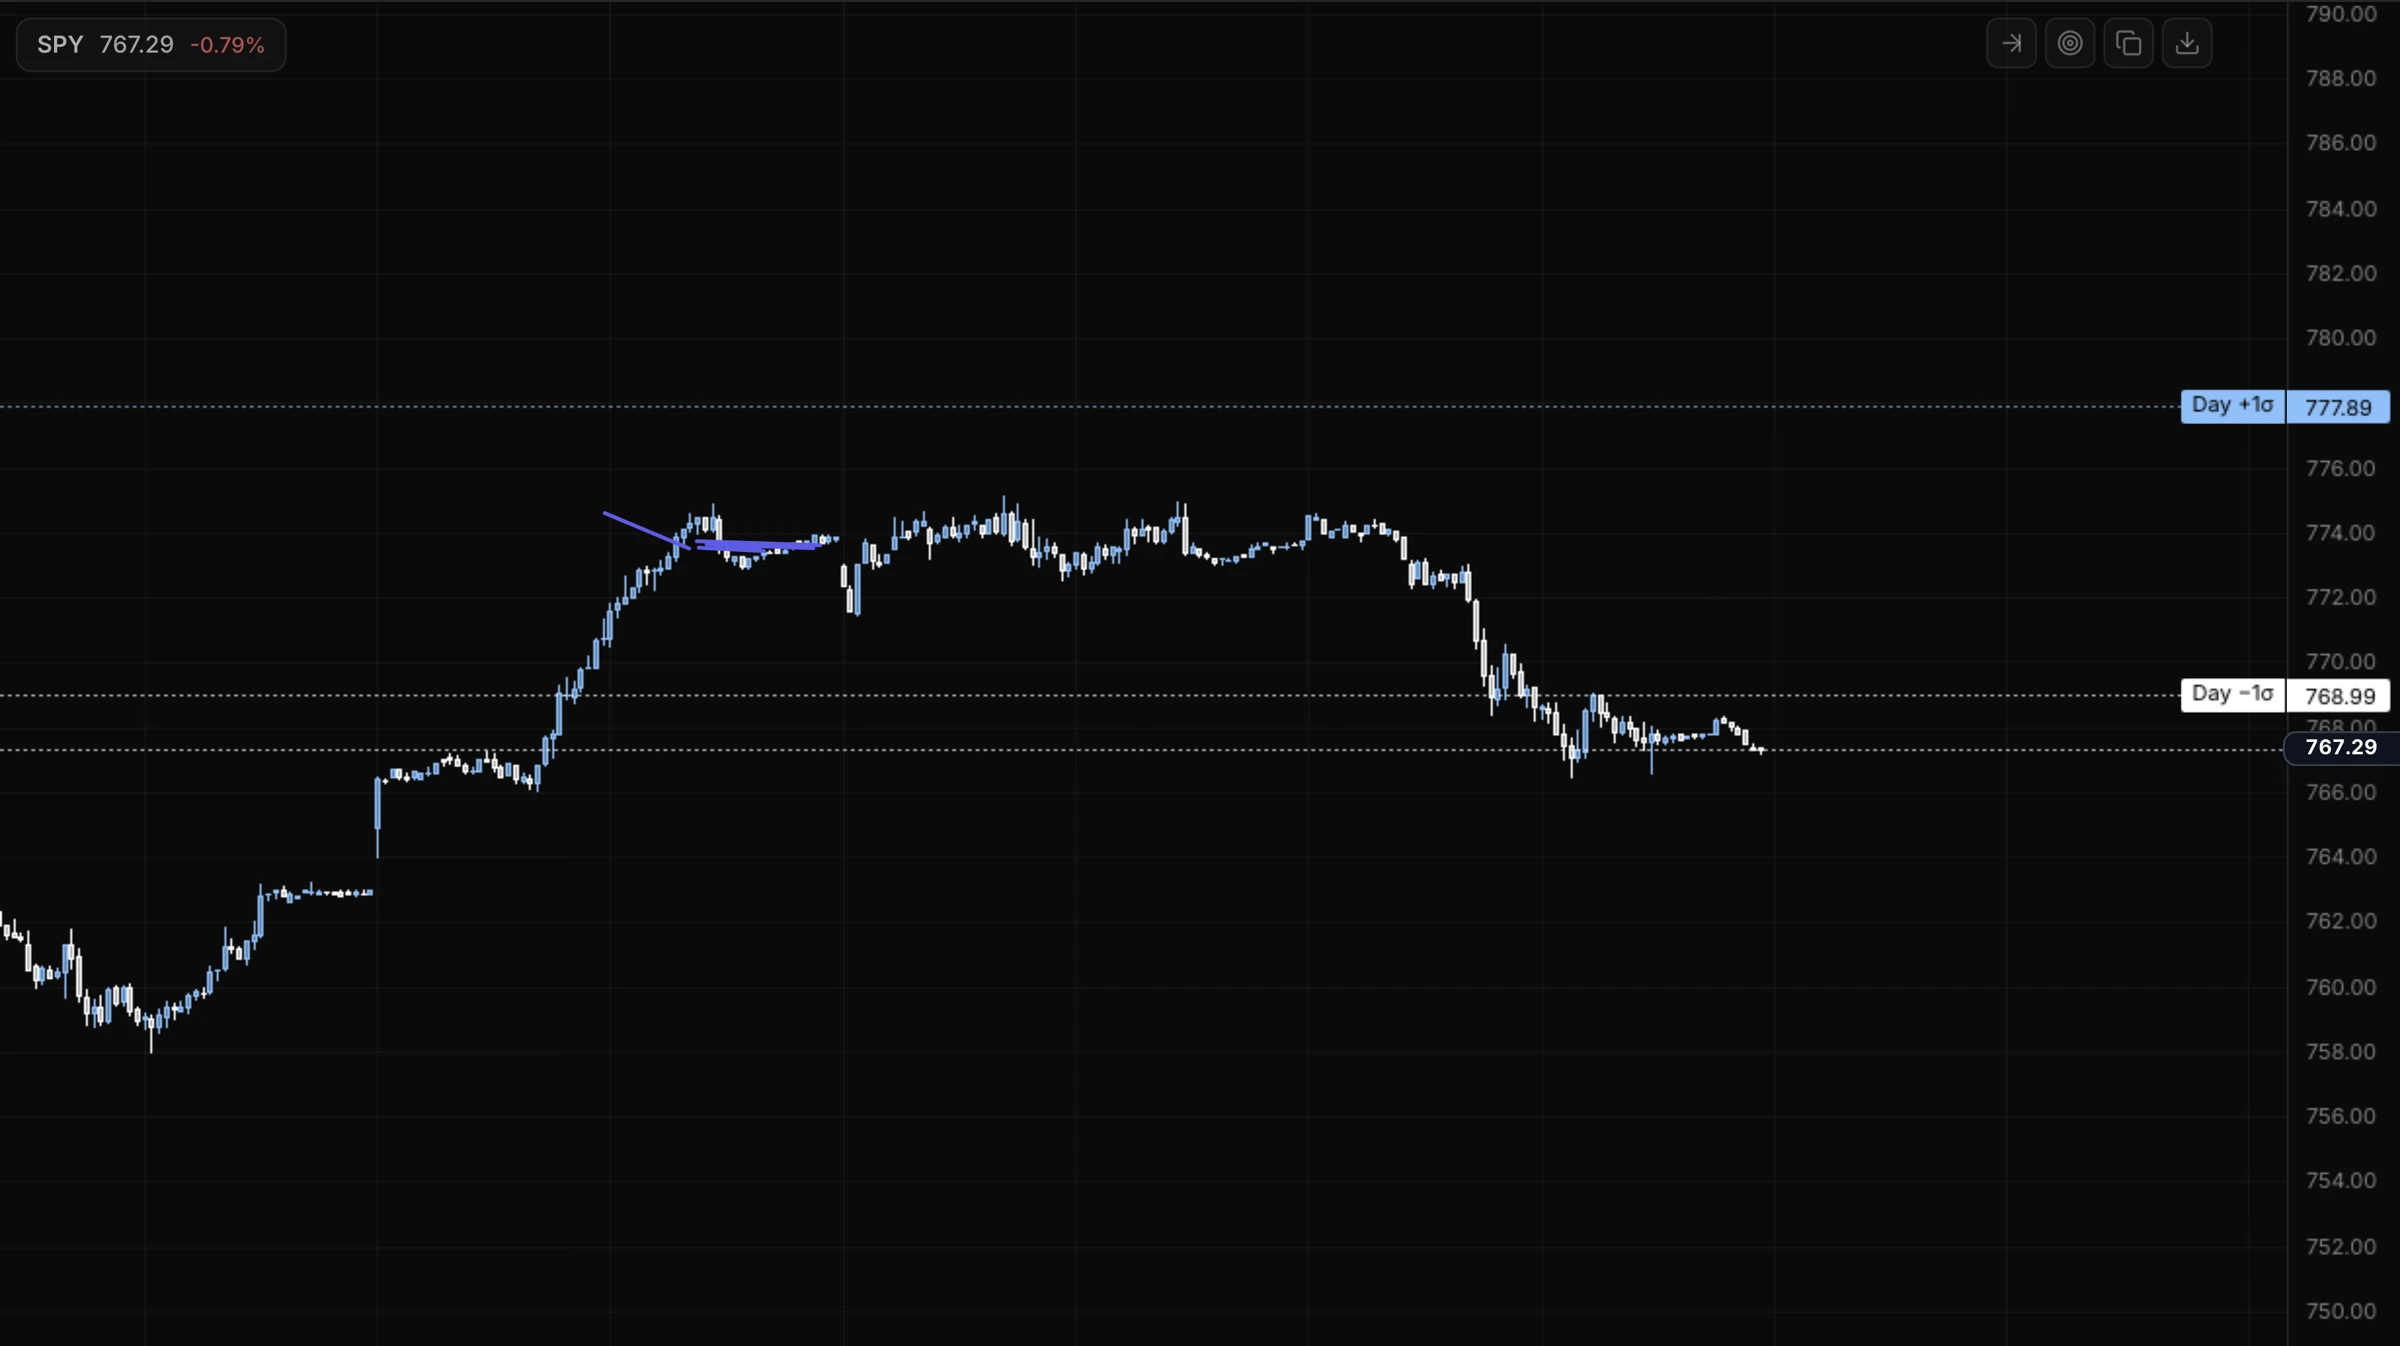
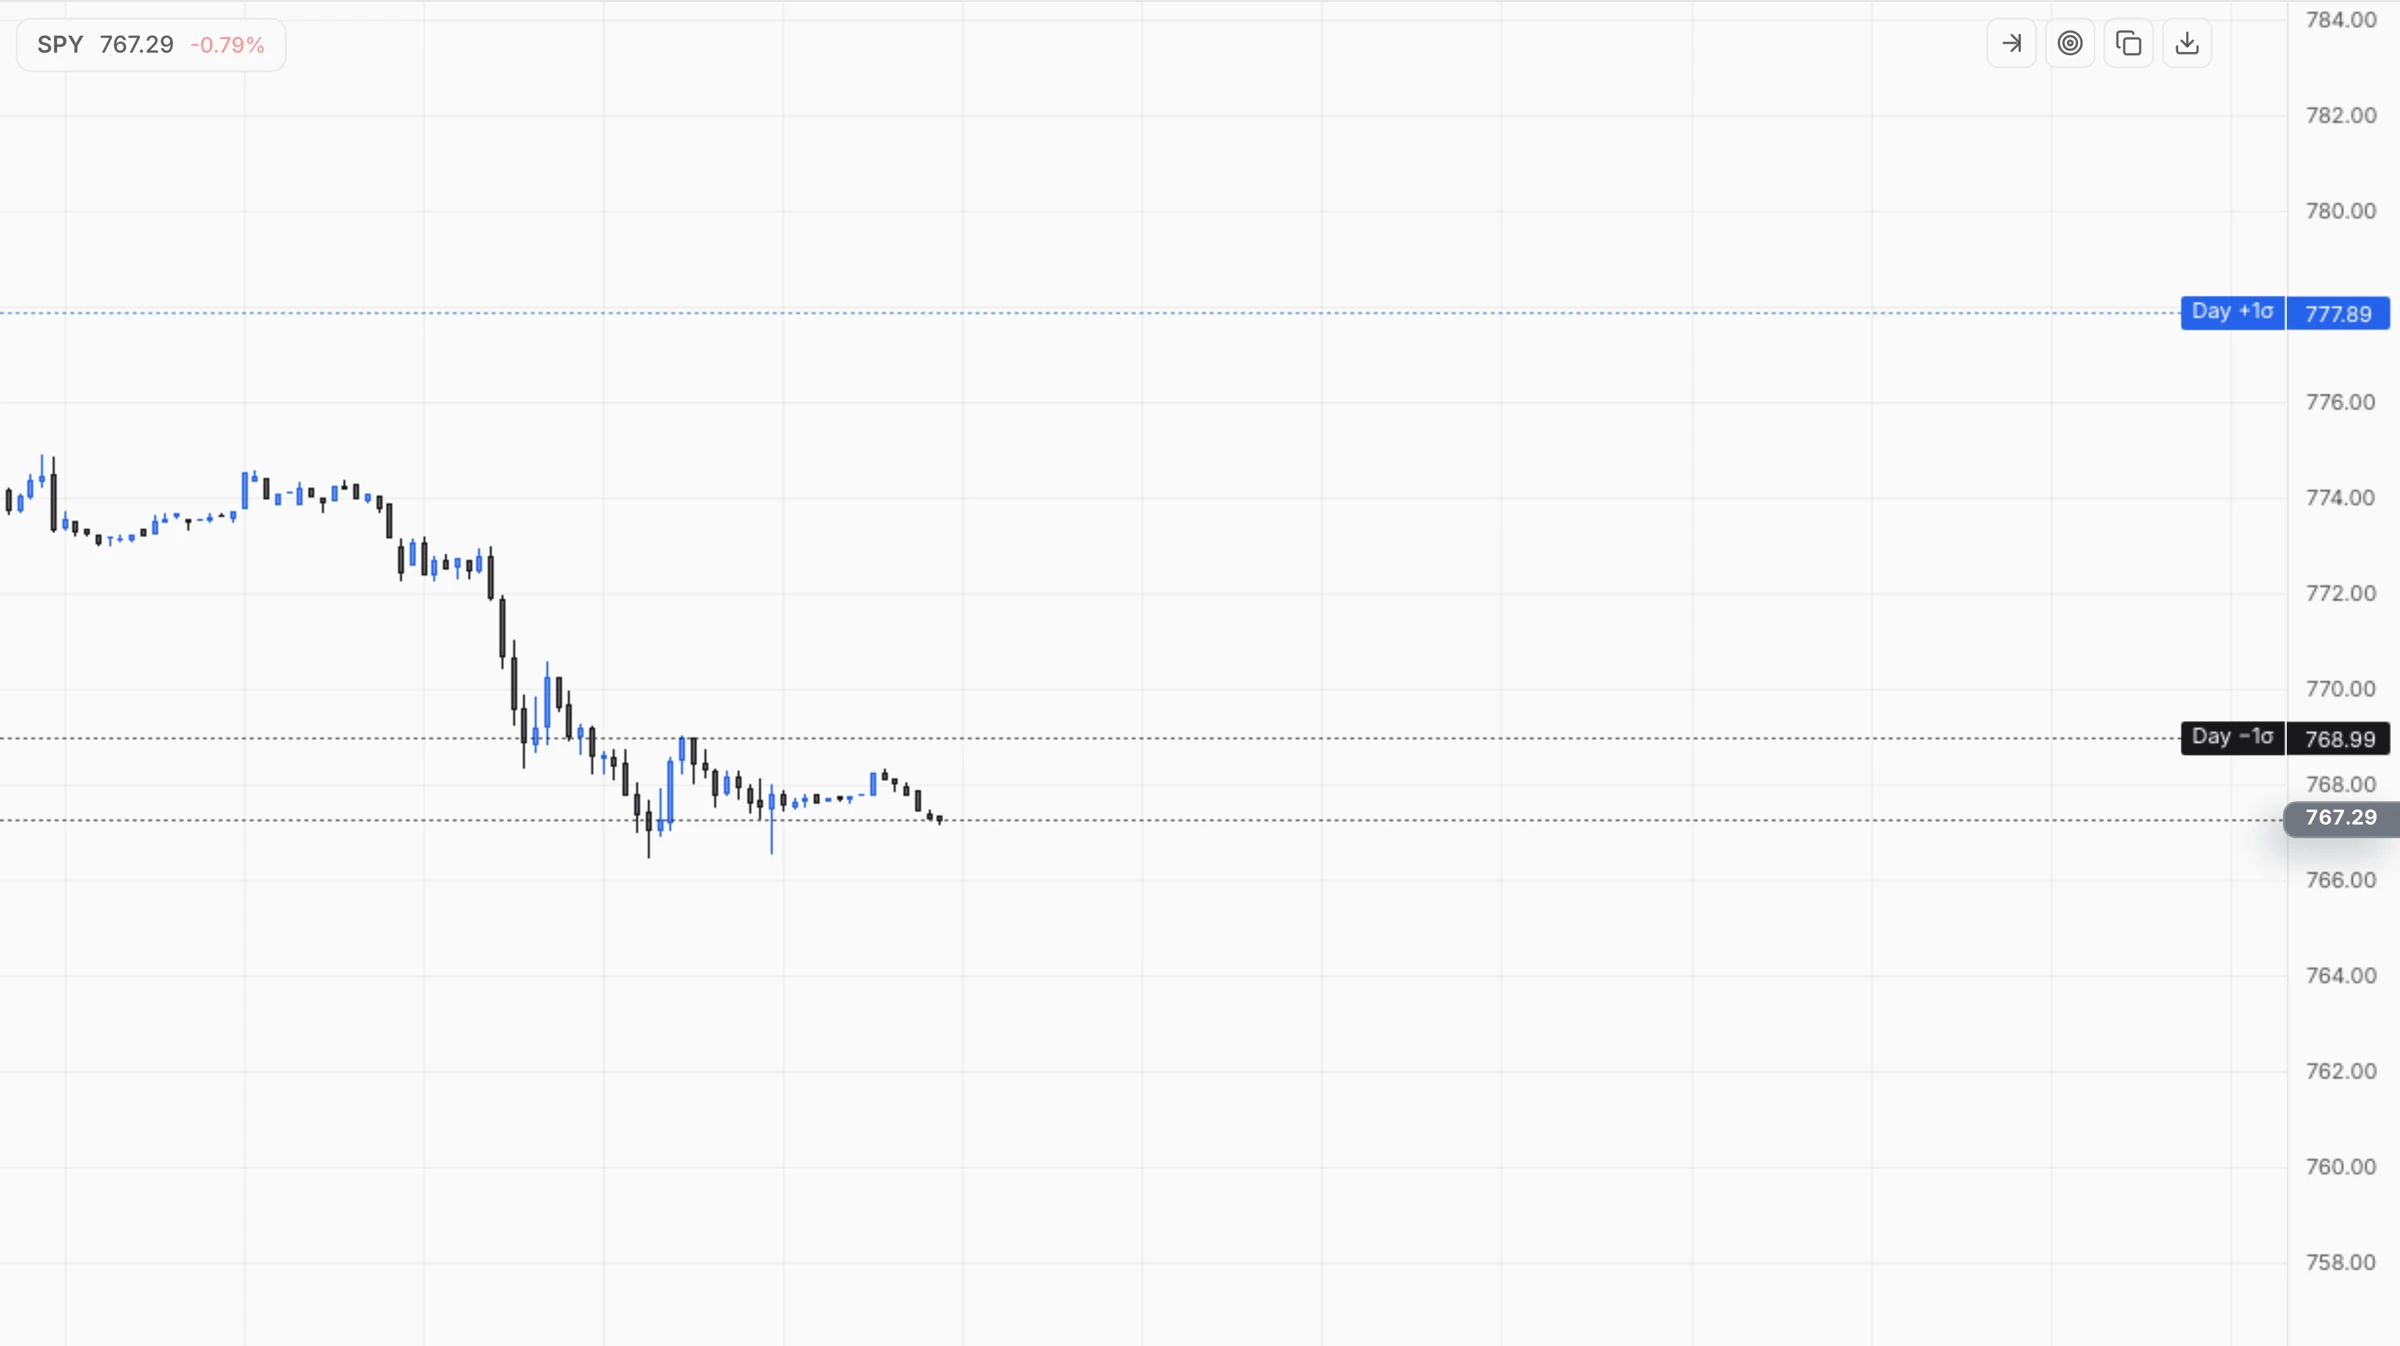
The priced range, drawn on your chart.
Turn on the Tempest plugin in Atlas and the range options are pricing sits right on your candles, next to Skylit's exposure levels. Ready-made lines for targets, stops and strikes, without switching screens.
- Daily range: today's 1σ range as priced at the prior close
- Weekly range from last week's close, with optional ±2σ lines
- Cones that project the priced range forward from the last candle
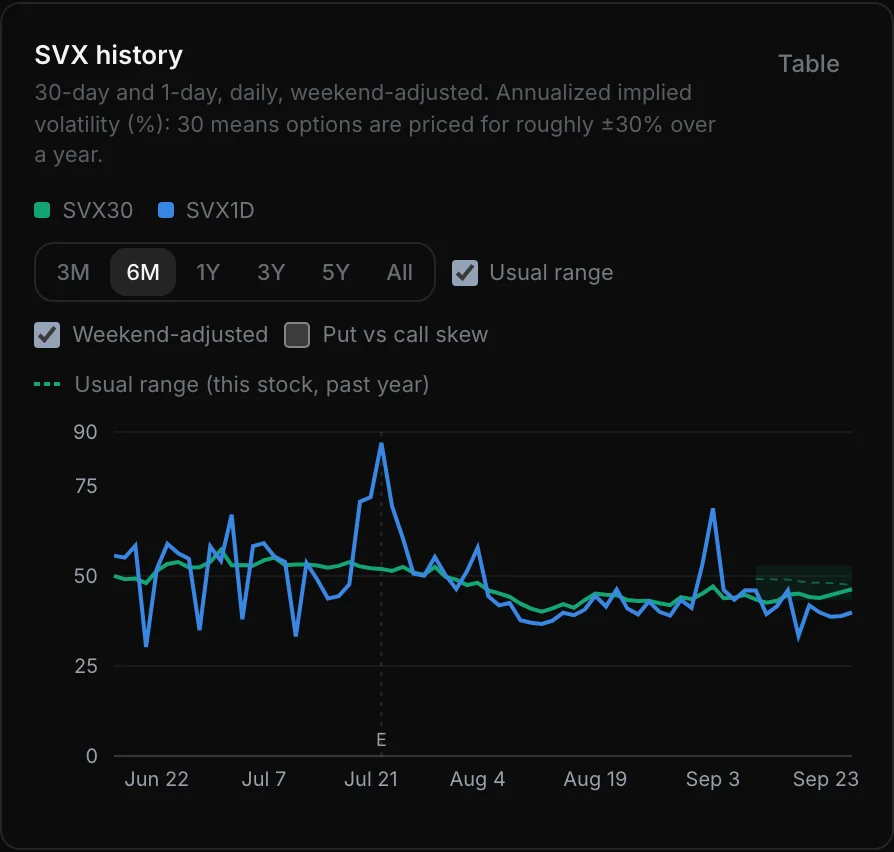
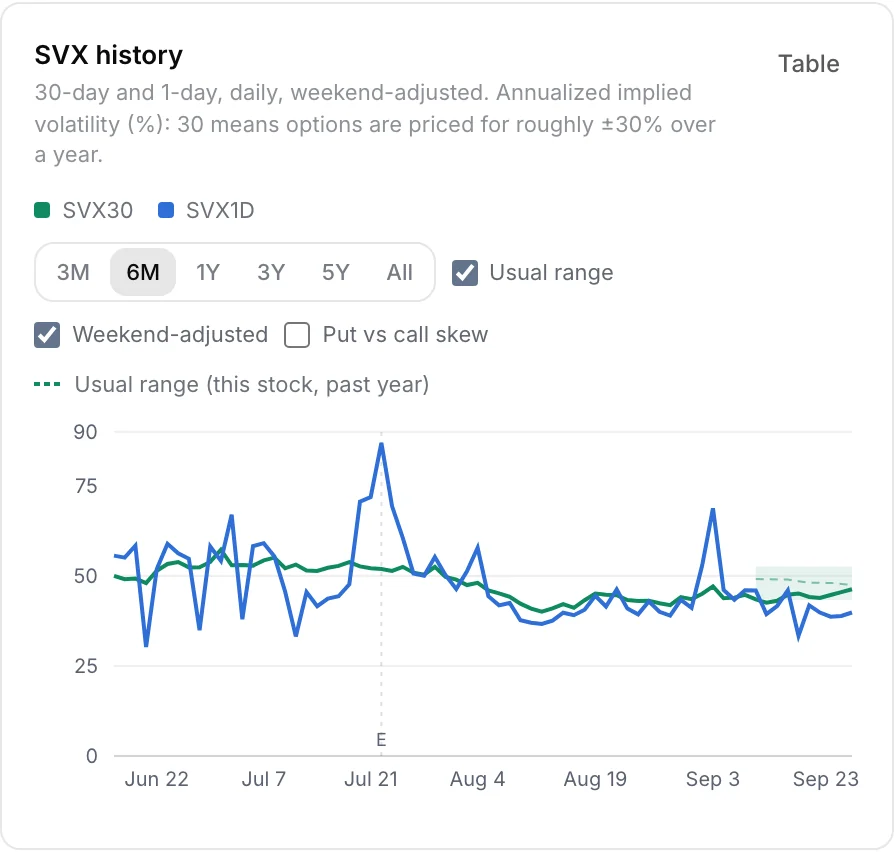
SVX history
Rich or cheap, for this stock.
A 61 can be expensive for one stock and a bargain for another. Tempest shows each stock's usual range and where today sits in it, with earnings marked on the line.
- Percentile and IV rank against 1, 3 or 5 years
- Weekend-adjusted, so Fridays stop looking cheap just for being Fridays
Sigma
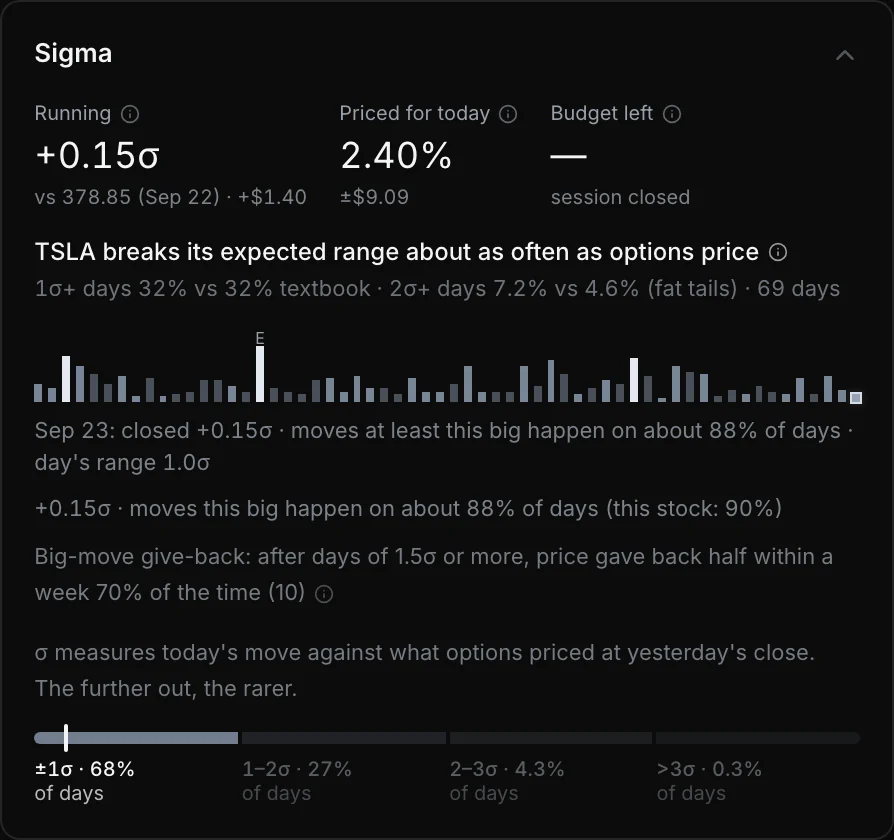
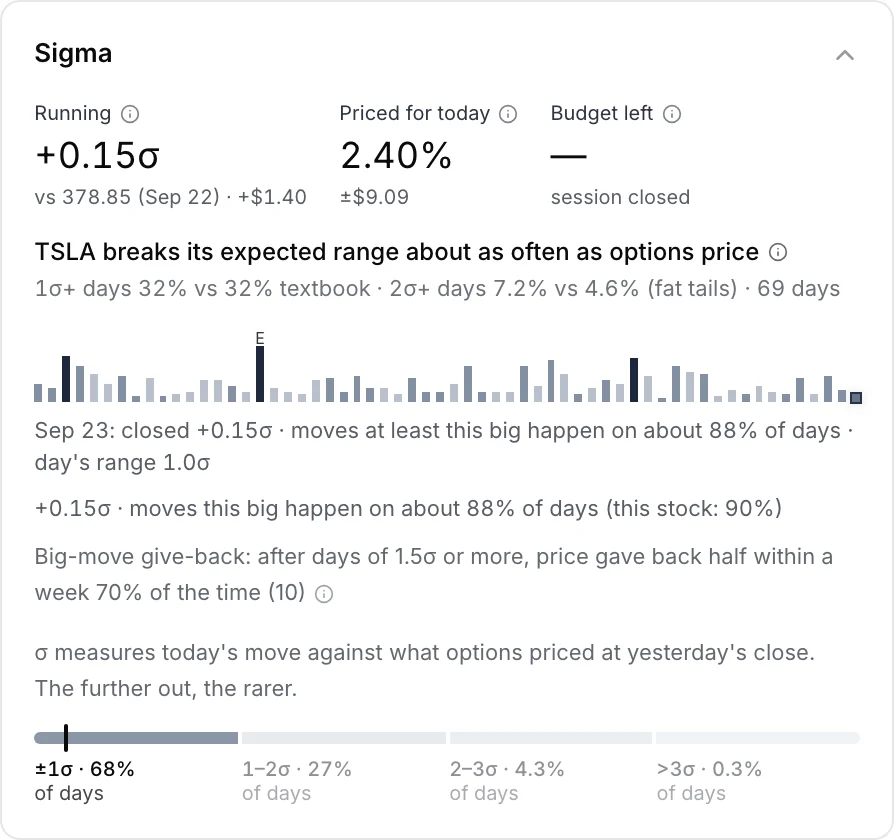
Was that move normal?
Every day's move measured in expected moves. Under 1σ is an ordinary day. 2σ happens on about 5% of days, 3σ on about 0.3%.
- Running sigma through the session, and how much of today's priced move is left
- How often this stock breaks its range compared with the textbook
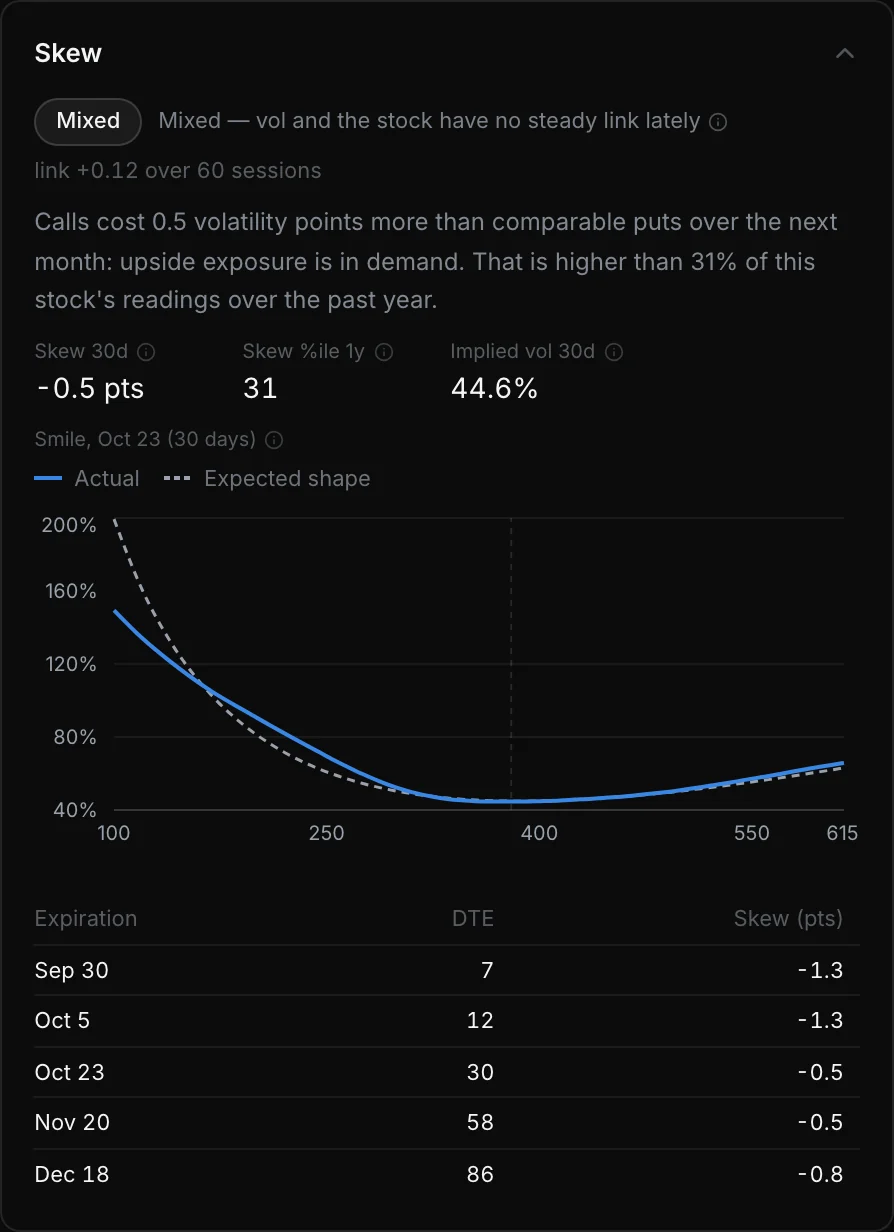
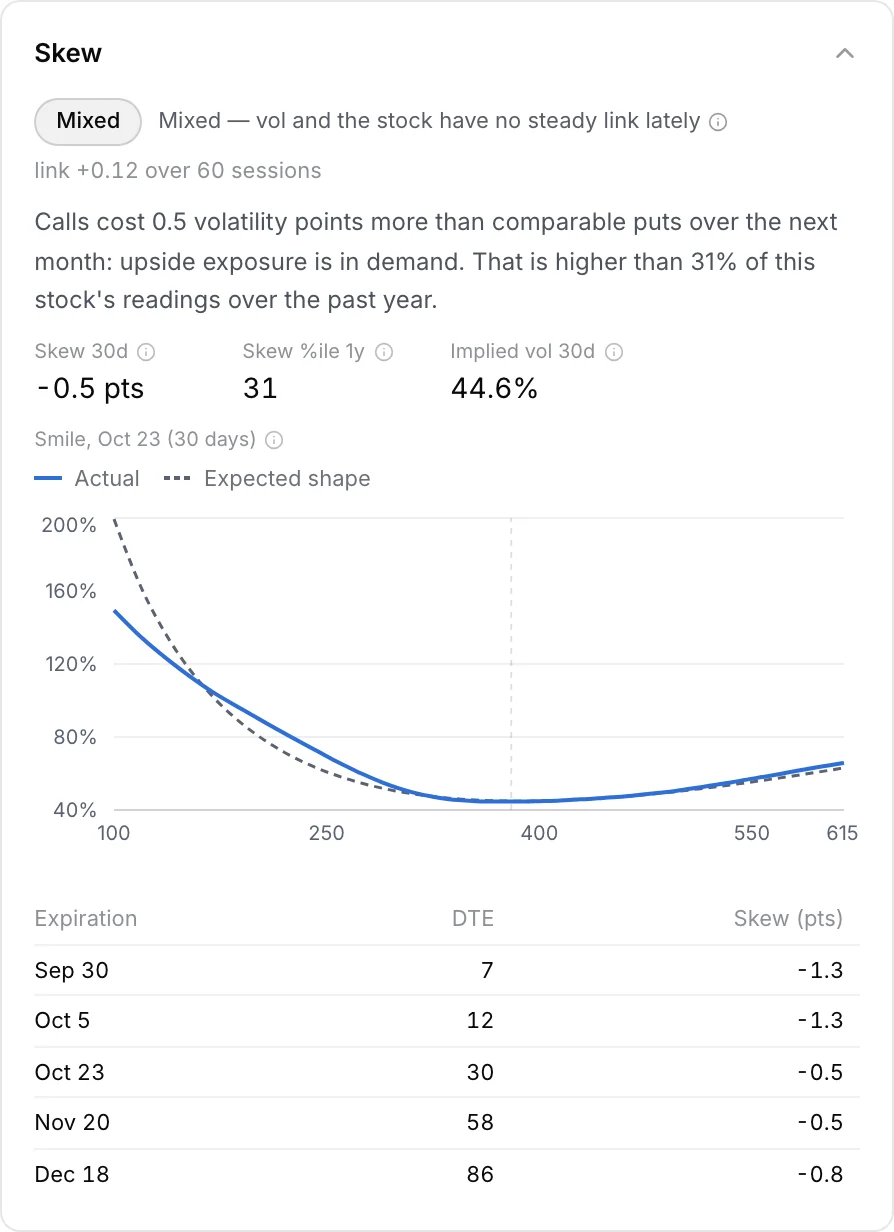
Skew
What protection costs, for this stock.
Are puts priced above calls, and by how much for this stock? The smile shows which strikes are priced above or below their usual shape, expiry by expiry.
- Skew flips toward calls, flagged on the radar
- Put skew against its own past year
Premium imbalance
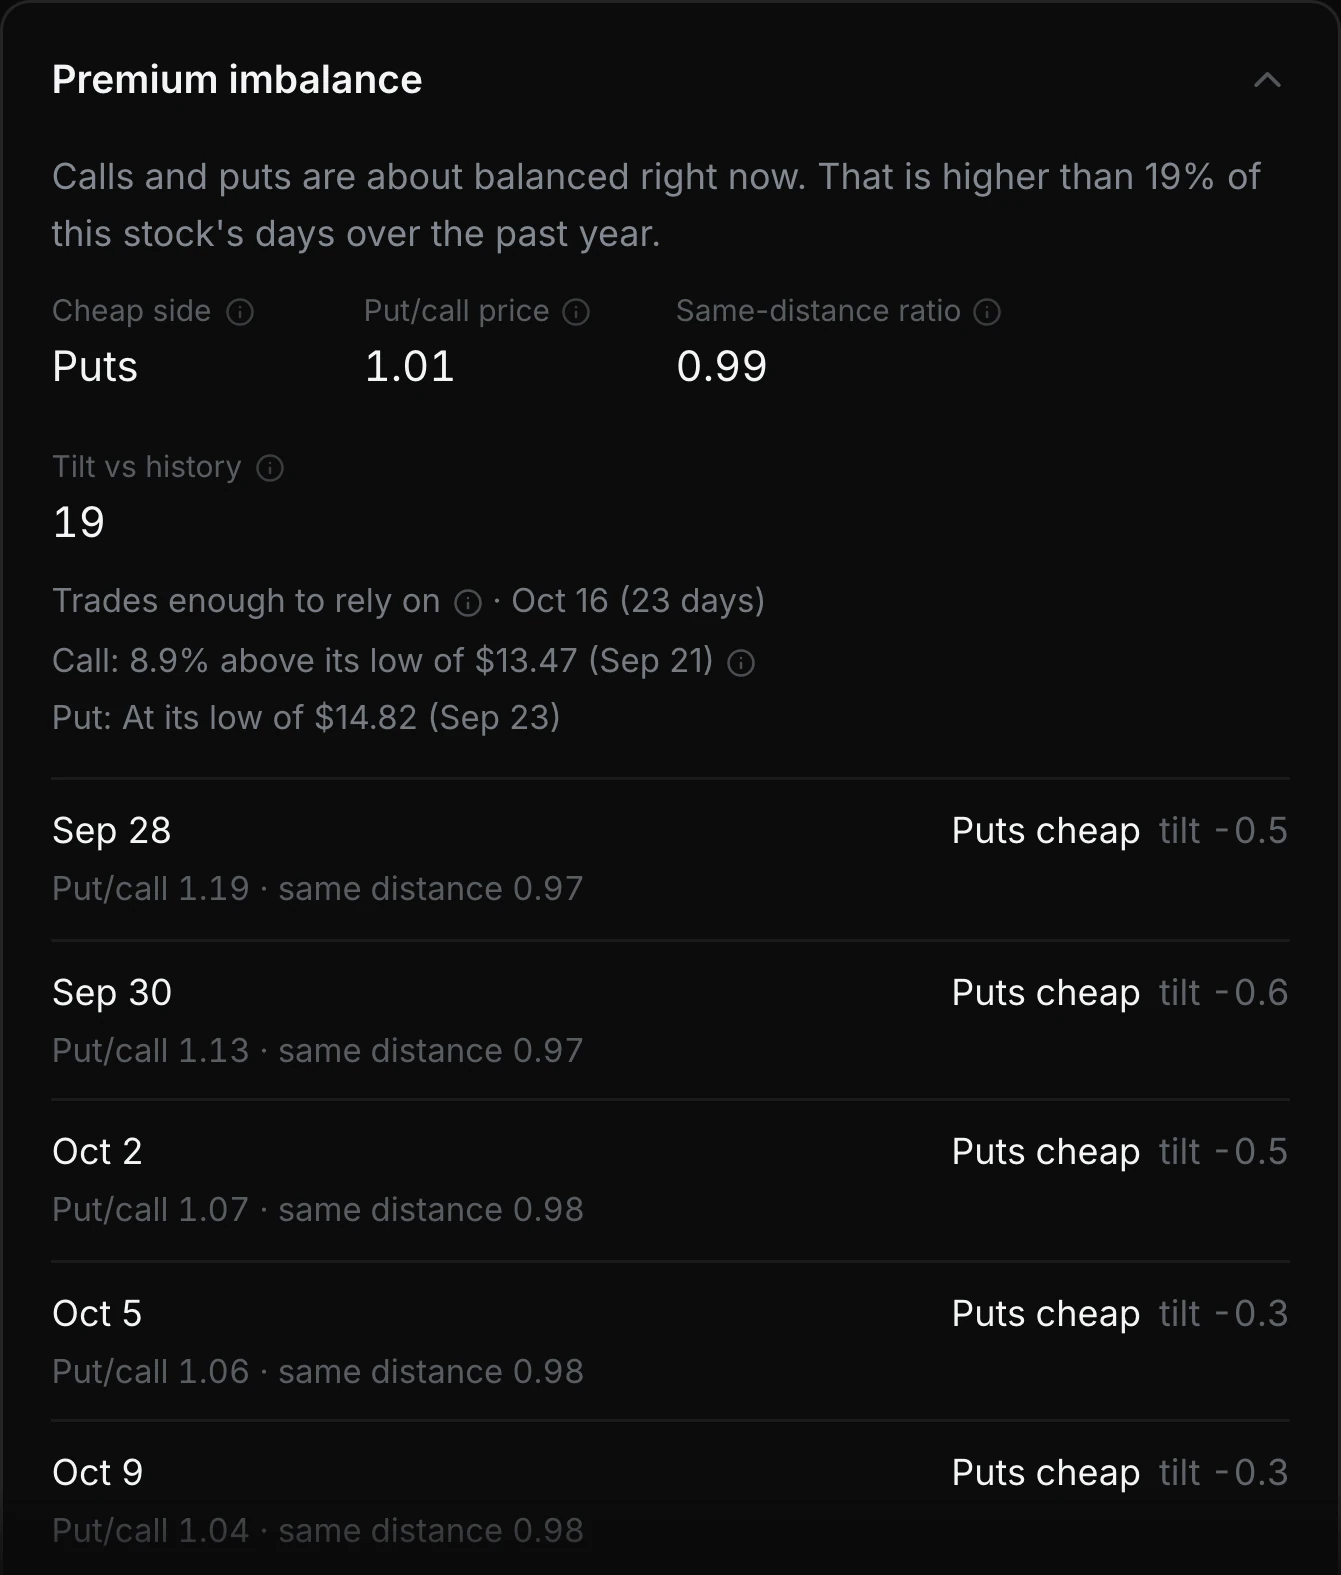
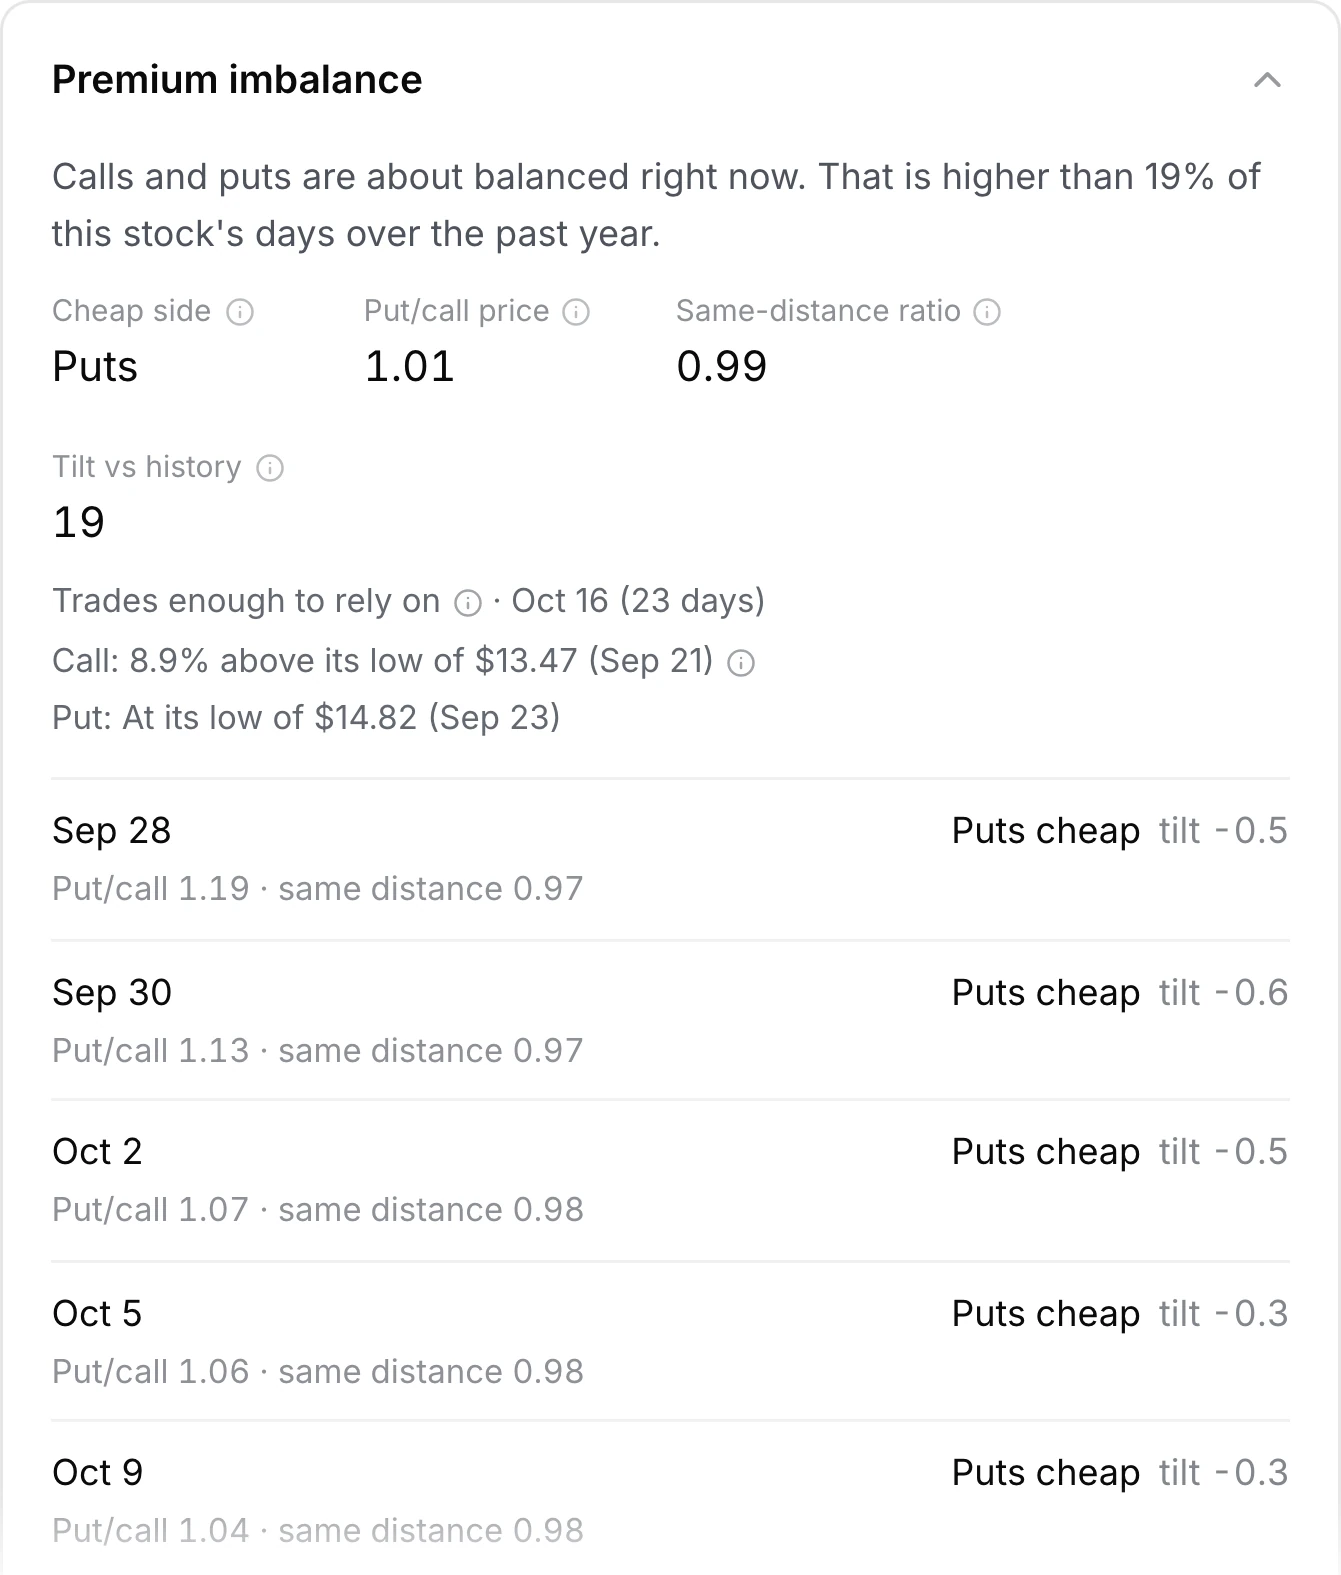
Calls or puts: which side is priced lower?
Out-of-the-money puts usually cost more than calls the same distance from price, and every stock has its own usual tilt. Premium imbalance asks whether one side is unusually cheap today, after allowing for that tilt. It shows which side is priced lower, not which way the stock will go.
- Cheap side, tilt and tilt against the past year
- Each leg next to its lowest price, and the tilt for every expiration
- Only counted on actively traded contracts
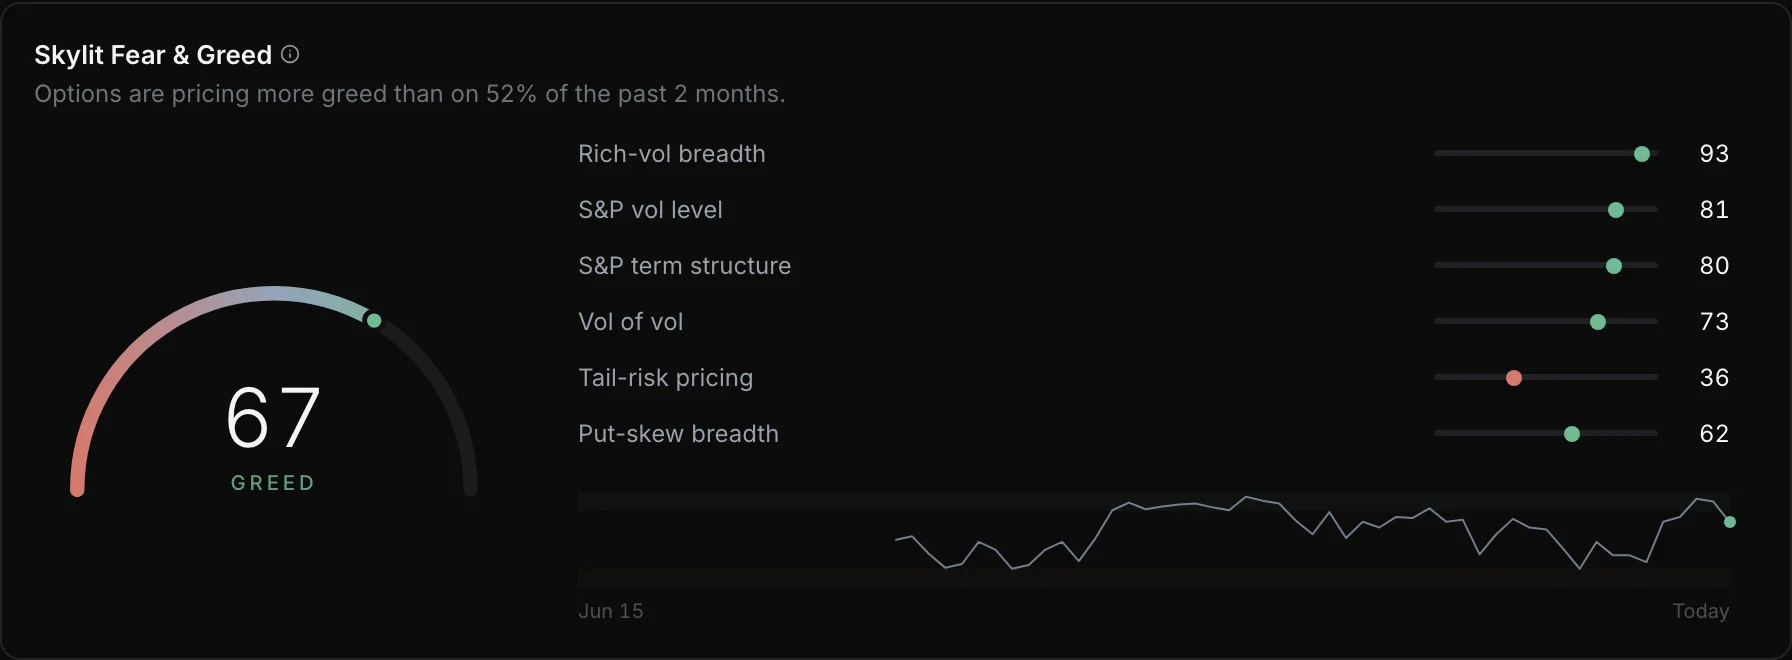
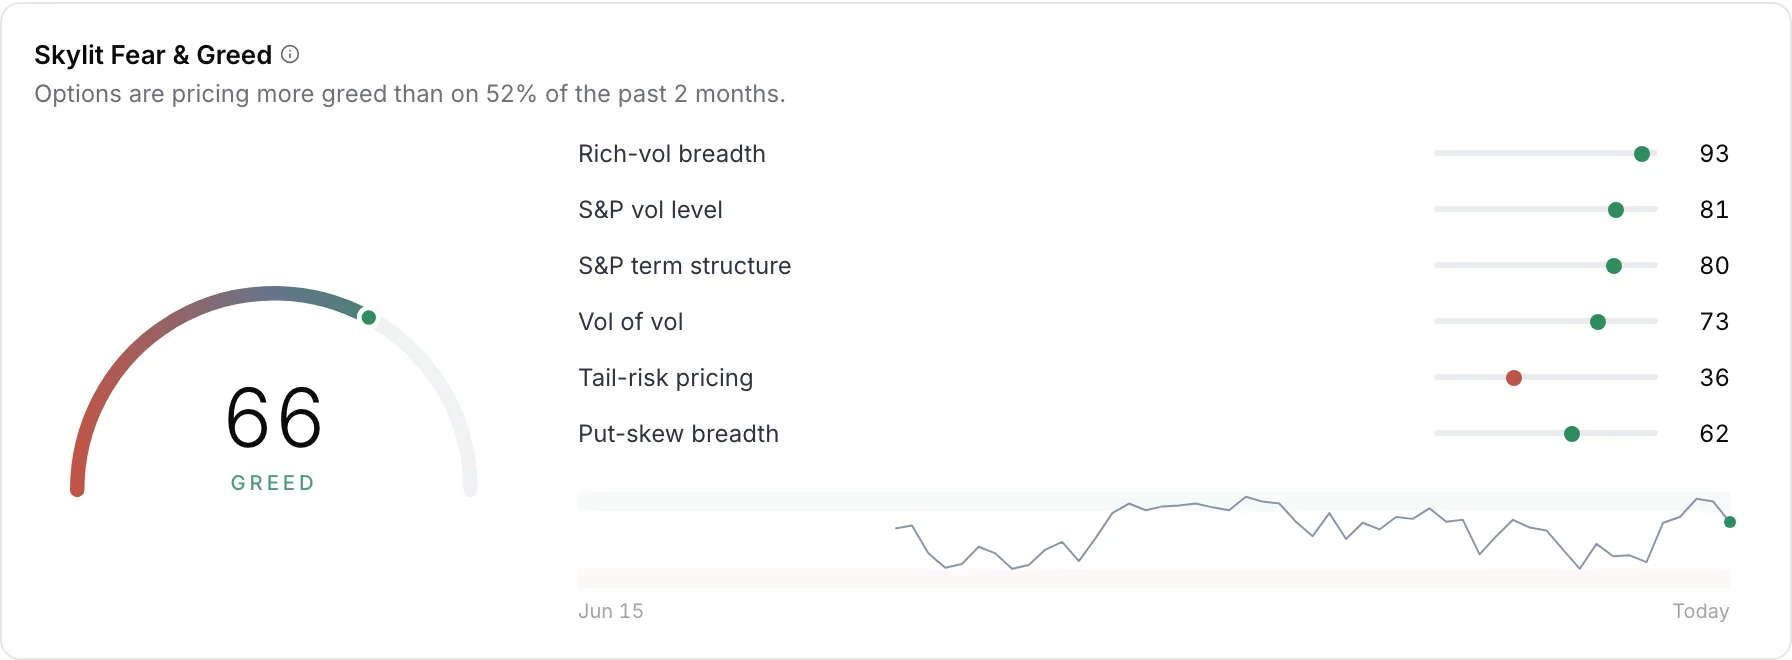
Skylit Fear & Greed
The market's mood, from what traders pay.
One 0 to 100 score read from option prices, not headlines or surveys. The components driving it come first, and every stock can get its own.
- A one-word volatility regime: calm to crisis
- Term structure, vol of vol and tail-risk pricing on the Market tab
Setups
Past episodes, with the base rate beside it.
One memorable chart can mislead. For each stock, Tempest finds the past times it was in the same condition and shows what followed, always next to how often that happens anyway. History, not a forecast.
Ask Talon
Ask in plain English.
- Which names have cheap vol right now?
- Is NVDA's premium rich or cheap?
- NVDA expected move this week
- Cheap vol names with upside exposure skew
- What sigma did SPY close yesterday?
- What is the vol regime?



FAQ
Questions about Tempest
What is Tempest?
A volatility suite for every stock. It shows how big a move options are pricing, whether that is a lot for that stock, and how the market as a whole is pricing risk.
What is SVX?
The Skylit Volatility Index: a VIX-style reading built for each stock from its own options, stated as a yearly percentage. SVX 30 means options are pricing about ±1.9% on a typical day.
Does Tempest tell me which way a stock will move?
No. It sizes the swing, not its direction. It describes what options are pricing, not what the stock will do.
Can I use Tempest now?
Tempest is in beta for Pro members. Not on Pro yet, or want to hear when it opens wider? Join the waitlist and we will email you.
Tempest is in beta for Pro members.
Join the waitlist to hear when it opens wider, or read the field guide to see how every reading works.
Tempest shows what options are pricing. It is not a forecast or a recommendation. Ranges are probabilities, not limits: prices can and do move beyond them.
Educational material, not financial advice. Nothing here is a recommendation to buy or sell any security. Options involve significant risk and are not suitable for every investor.